Press Release
CURVE SPORTS - West Regional Showcase

CURVE SPORTS - West Regional Showcase
CLICK HERE FOR AN EXCLUSIVE CURVE SPORTS DISCOUNT
1. Executive Summary & Field Distribution
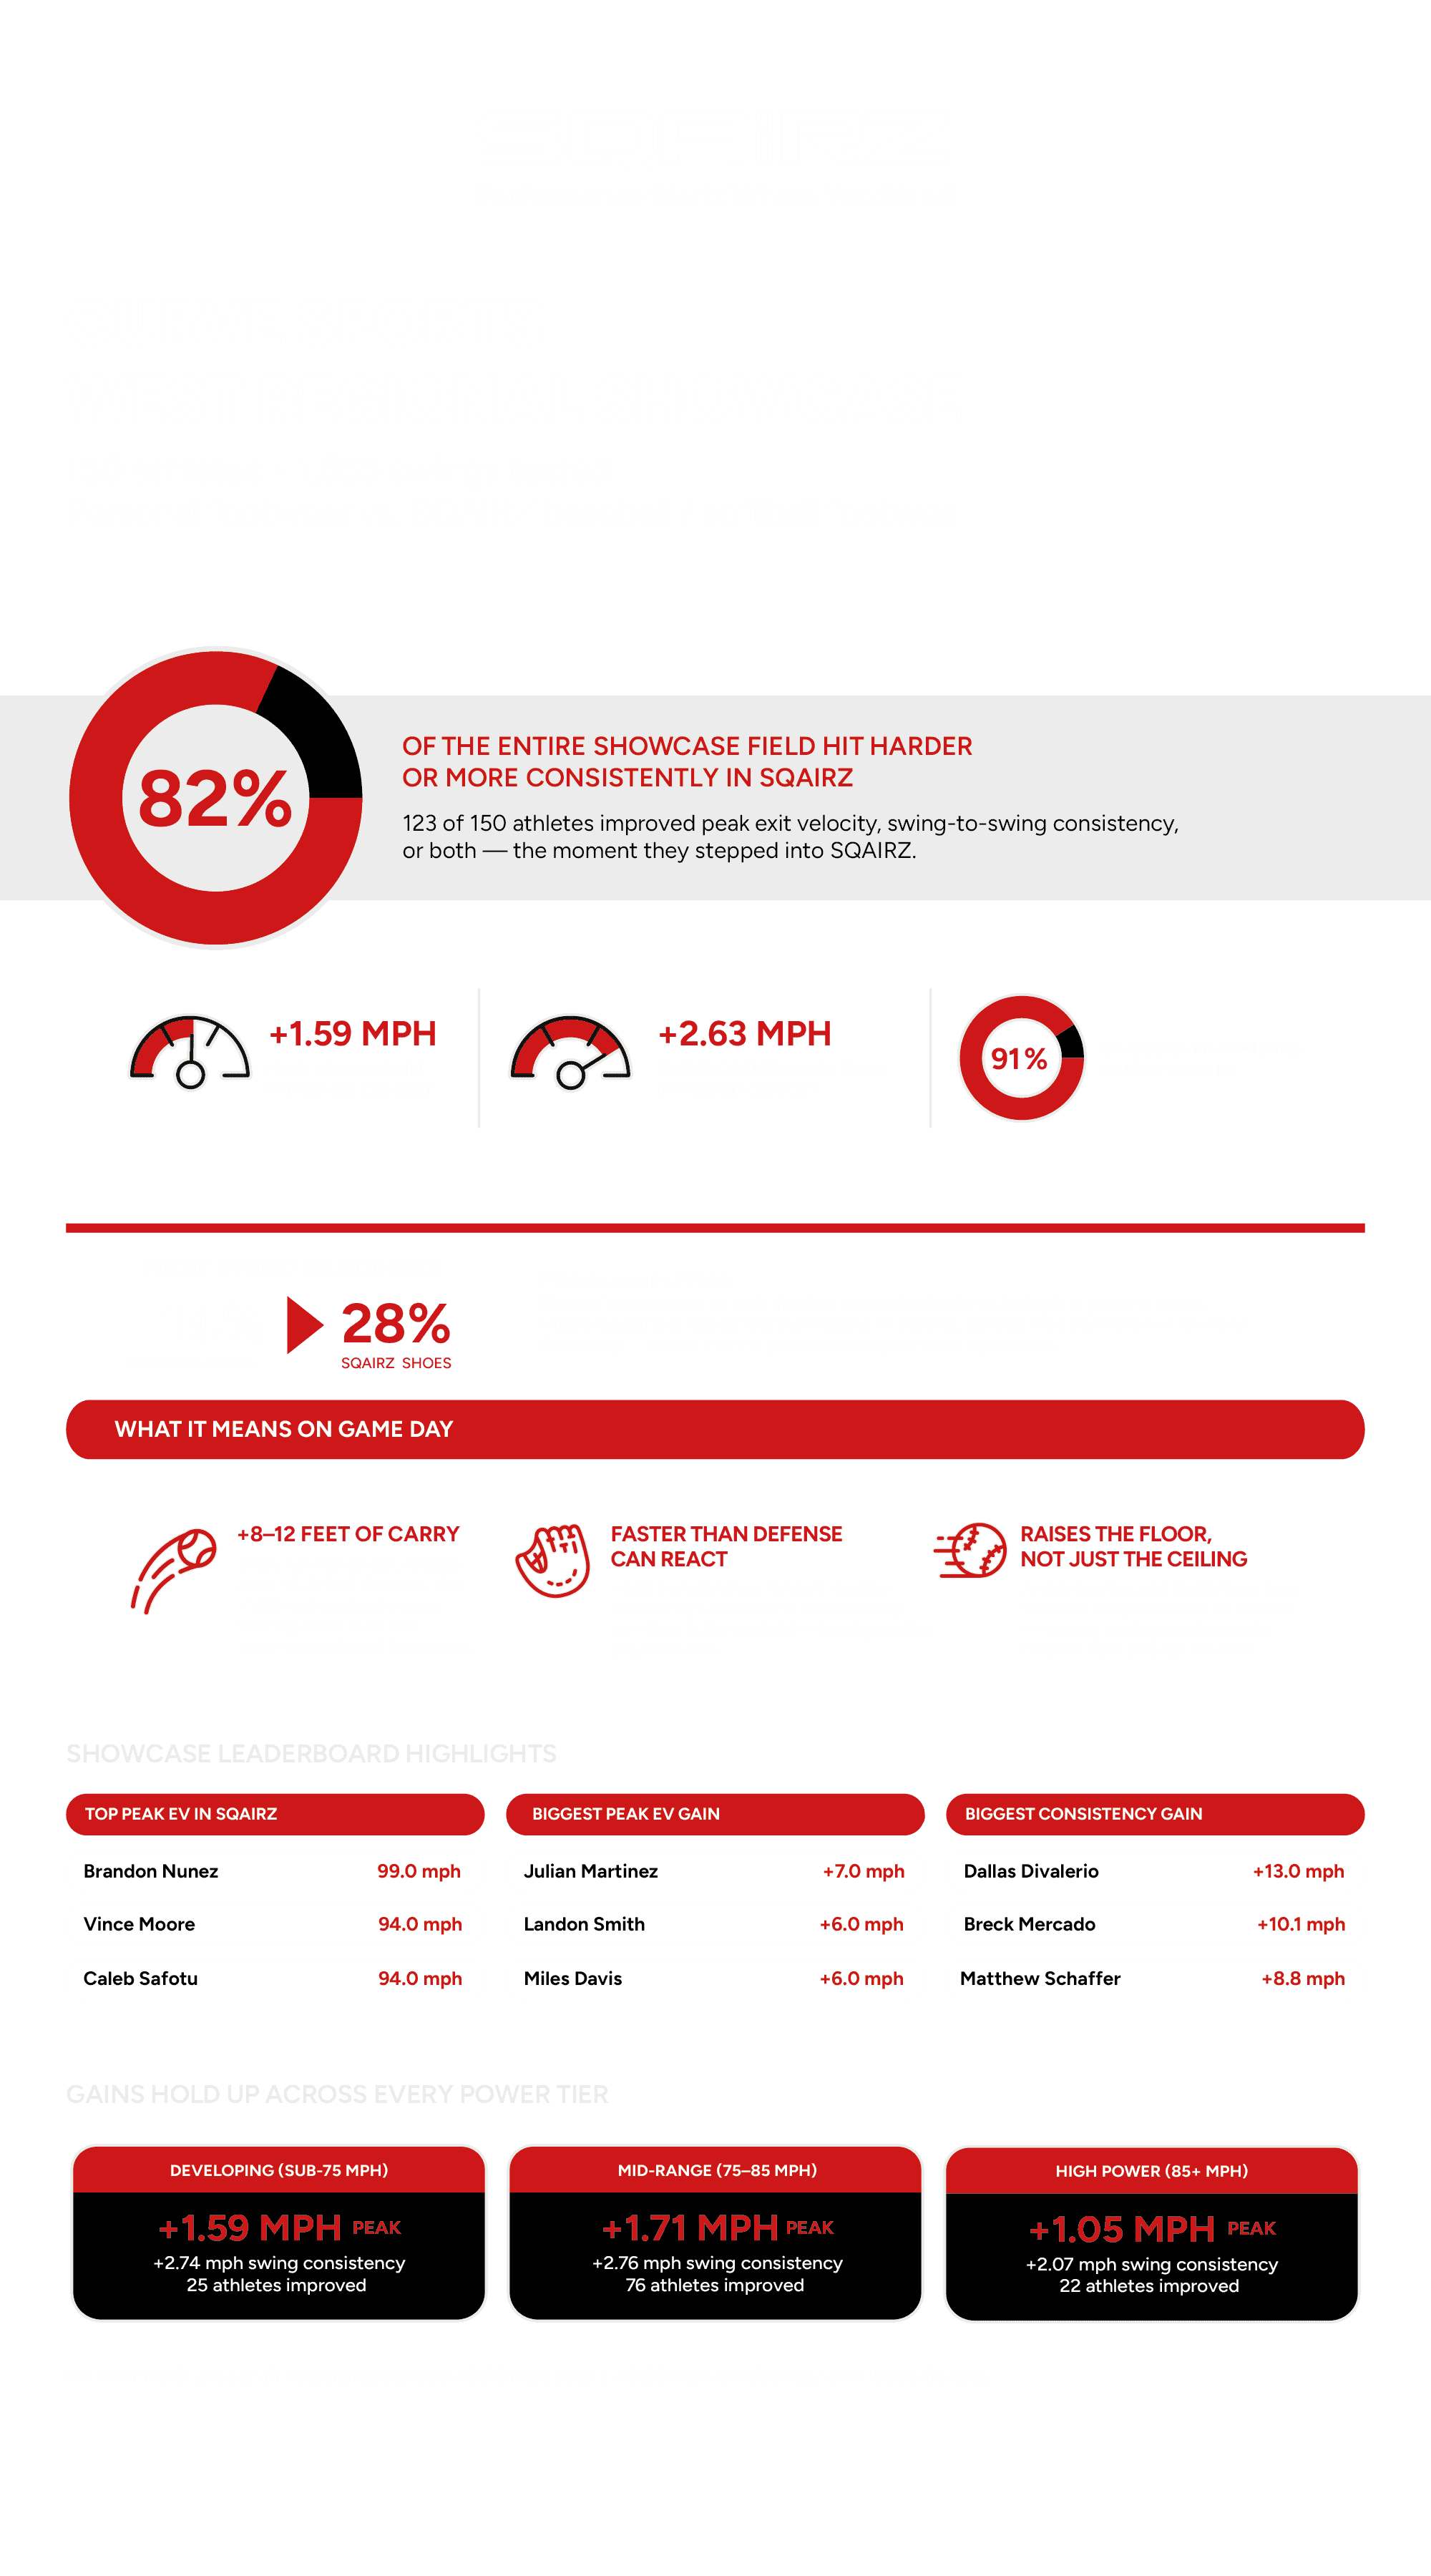
During the Curve Sports West Regional Showcase, 150 athletes completed tee testing comparing their personal footwear against SQAIRZ baseball/softball footwear across 1,655 recorded swings. To evaluate the true performance impact of SQAIRZ footwear, each athlete was assessed using their peak recorded velocities in SQAIRZ. Overall, 82.0% of the entire showcase field (123 out of 150 players) demonstrated a direct performance improvement in SQAIRZ—boosting either their peak exit velocity (Max EV), their swing-to-swing consistency (Average EV), or both. The remaining 27 players (18.0% of the field) experienced a slight performance drop (- 1.37 mph Max EV avg), primarily driven by initial shoe sizing misalignments or late-round fatigue.
MASTER SHOWCASE PERFORMANCE HIGHLIGHTS
- Total Showcase Evaluated: 150 athletes (100.0% of field)
- Overall Performance Boost (Field): 82.0% of athletes improved Peak OR Consistency (123 / 150)
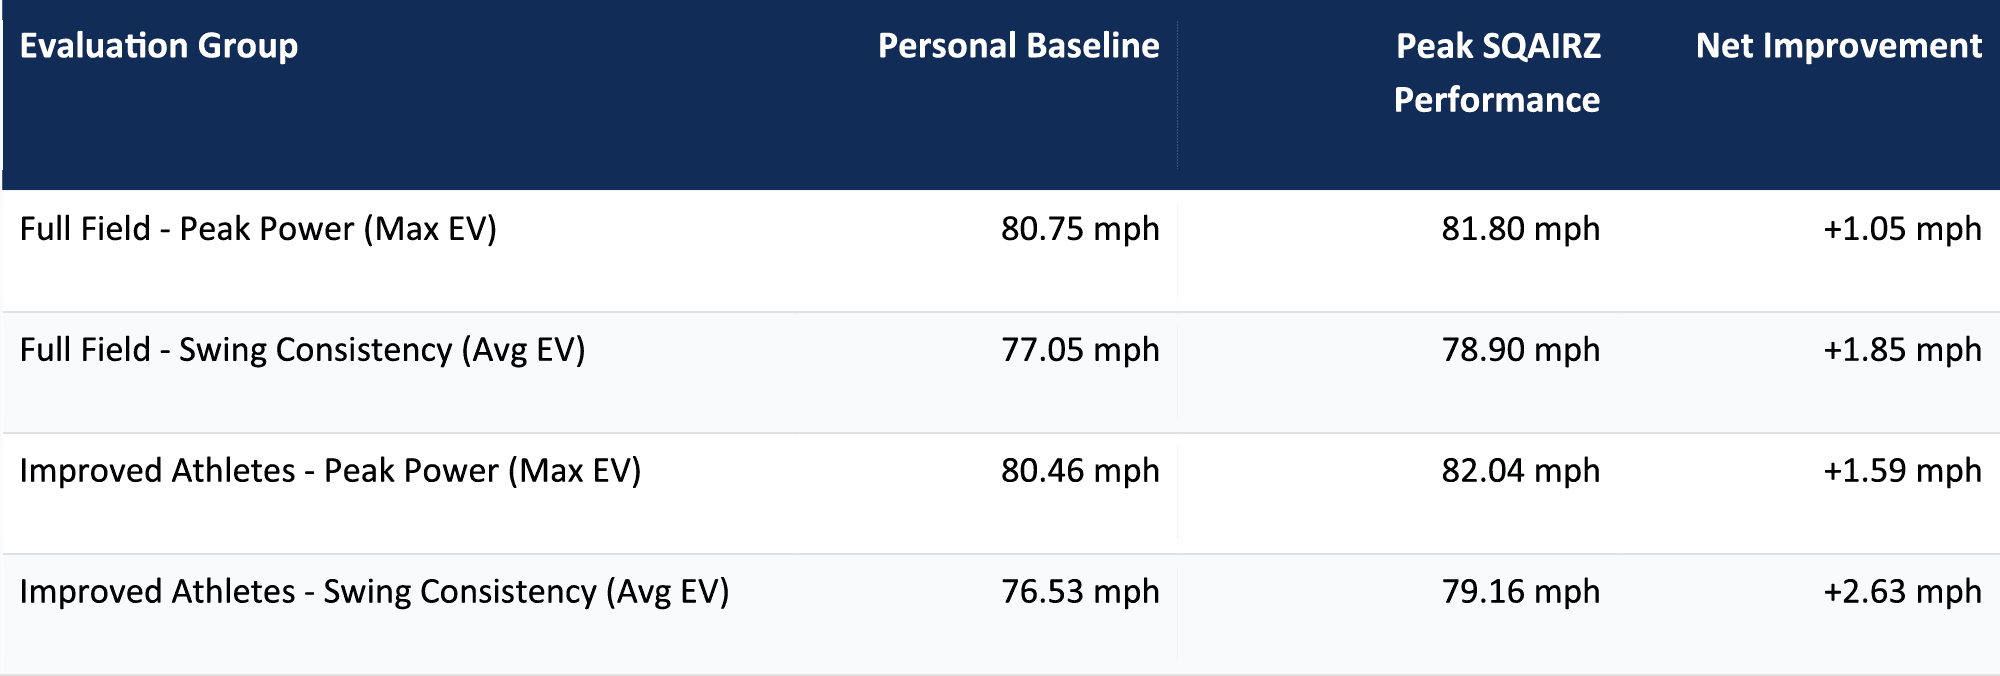
Average Peak Power Gain (Full Field): +1.05 mph lift (80.75 mph → 81.80 mph)
Average Swing Consistency Gain (Full Field): +1.85 mph lift (77.05 mph → 78.90 mph)
- Focus Cohort (123 Improved Athletes): 82.0% of field
Improved Cohort Peak Power Gain: +1.59 mph lift (80.46 mph → 82.04 mph)
Improved Cohort Consistency Gain: +2.63 mph lift (76.53 mph → 79.16 mph)
- Context Note (Remaining 27 Players): 0 Unchanged | 27 Declined (-1.37 mph Max EV avg)
2. Core Performance Analysis (Improved Athletes)
Zooming in on the 123 athletes who improved in SQAIRZ provides a clear picture of how SQAIRZ unlocks kinetic energy from the ground:
Peak Power (Max EV): 92 athletes specifically boosted their maximum exit velocity, gaining an average of +1.59 mph in peak power over their personal shoes.
Swing Consistency (Average EV): 112 athletes elevated their average exit velocity across all swings, raising their baseline swing consistency by +2.63 mph.
Dual Performance Boost: 81 athletes improved BOTH their peak power and their swing-to-swing consistency simultaneously.
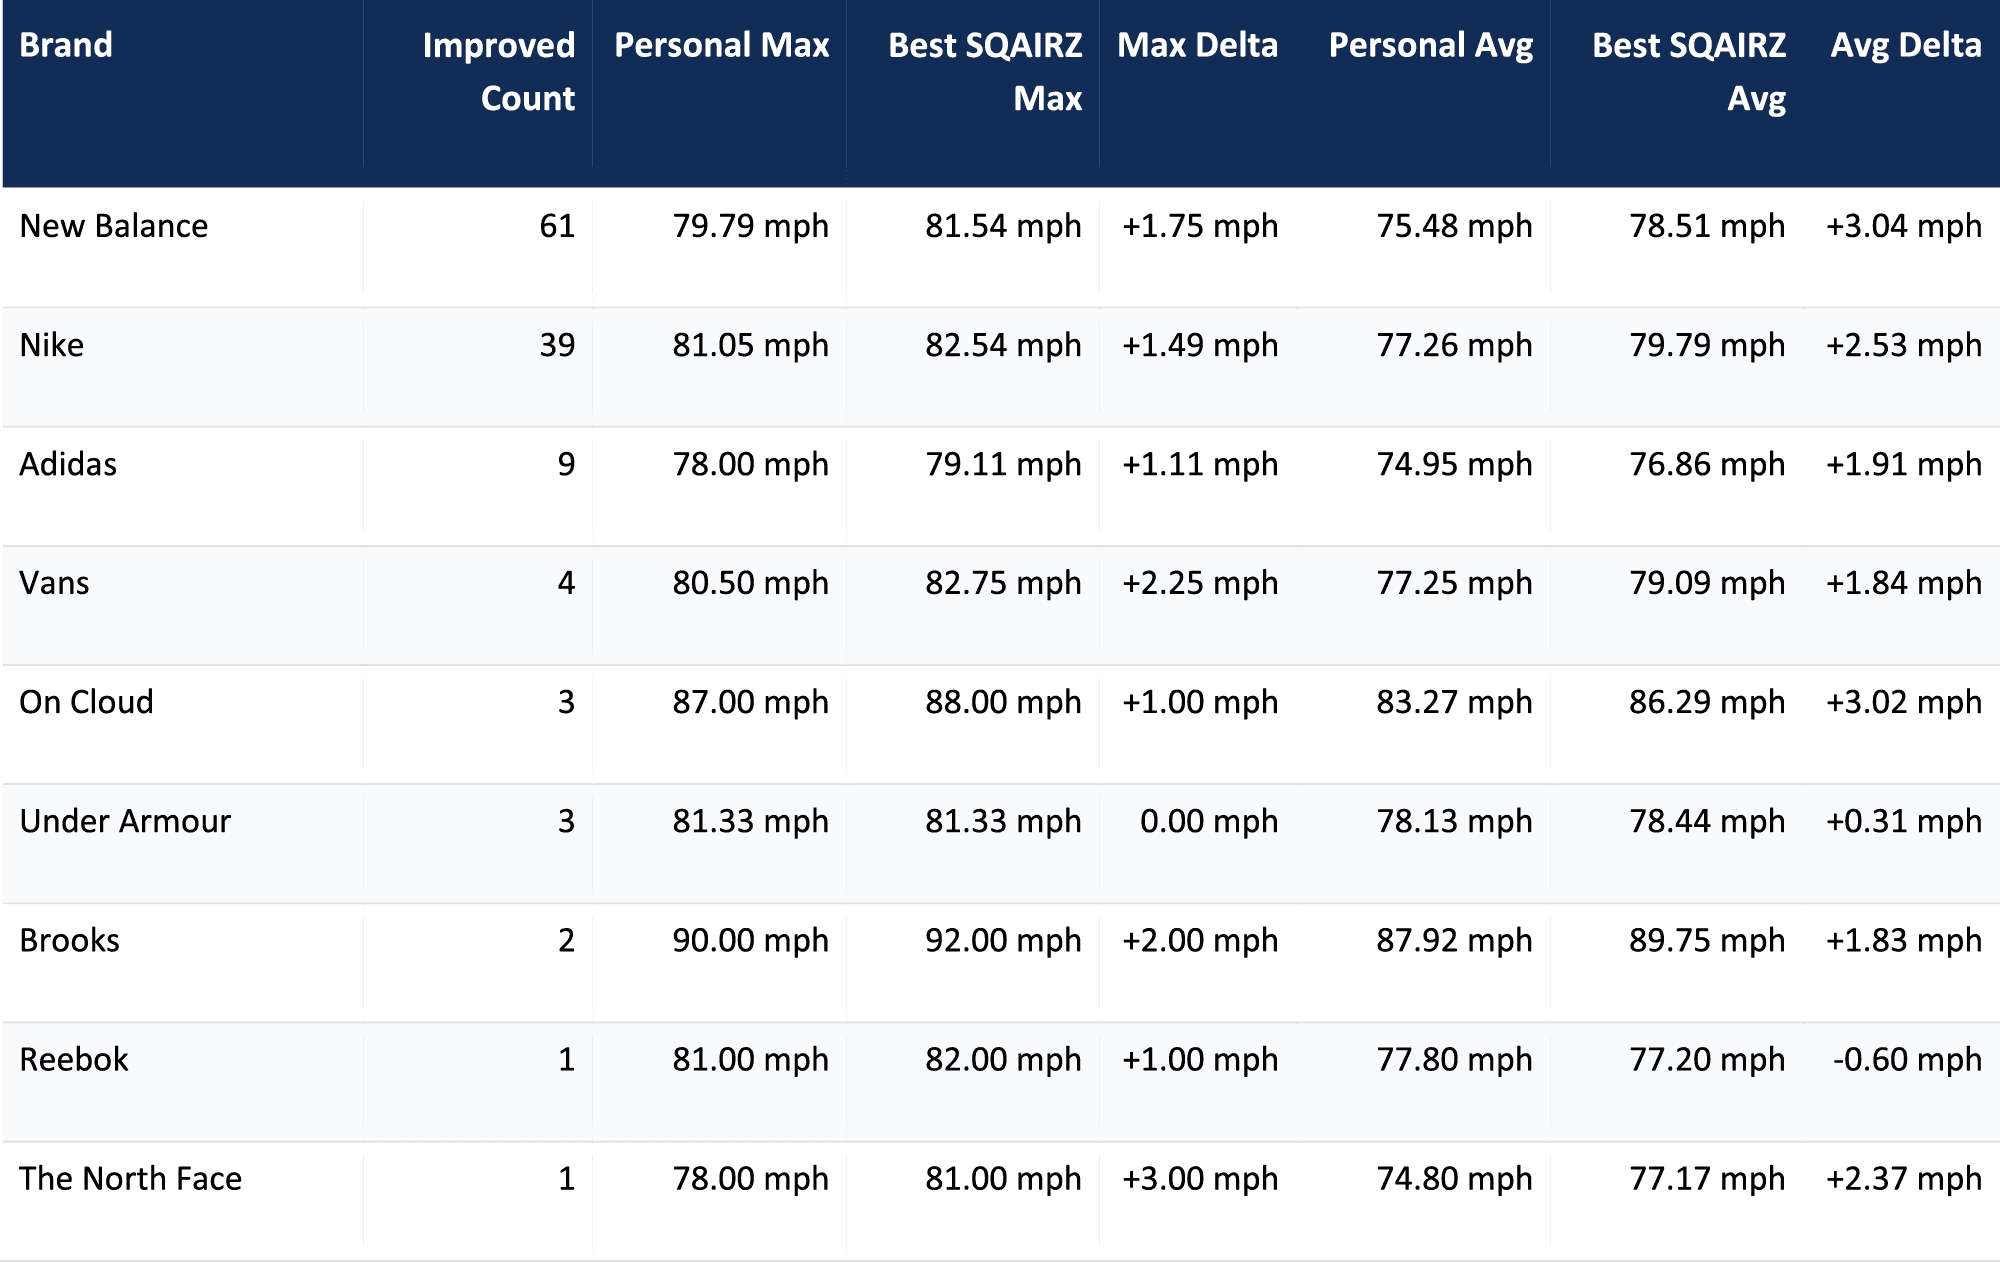
Footwear Brand Benchmark (123 Improved Athletes)
Tracking performance gains made by the improved athletes relative to the footwear brand they wore upon arriving at the showcase:
3. Official Showcase Leaderboards
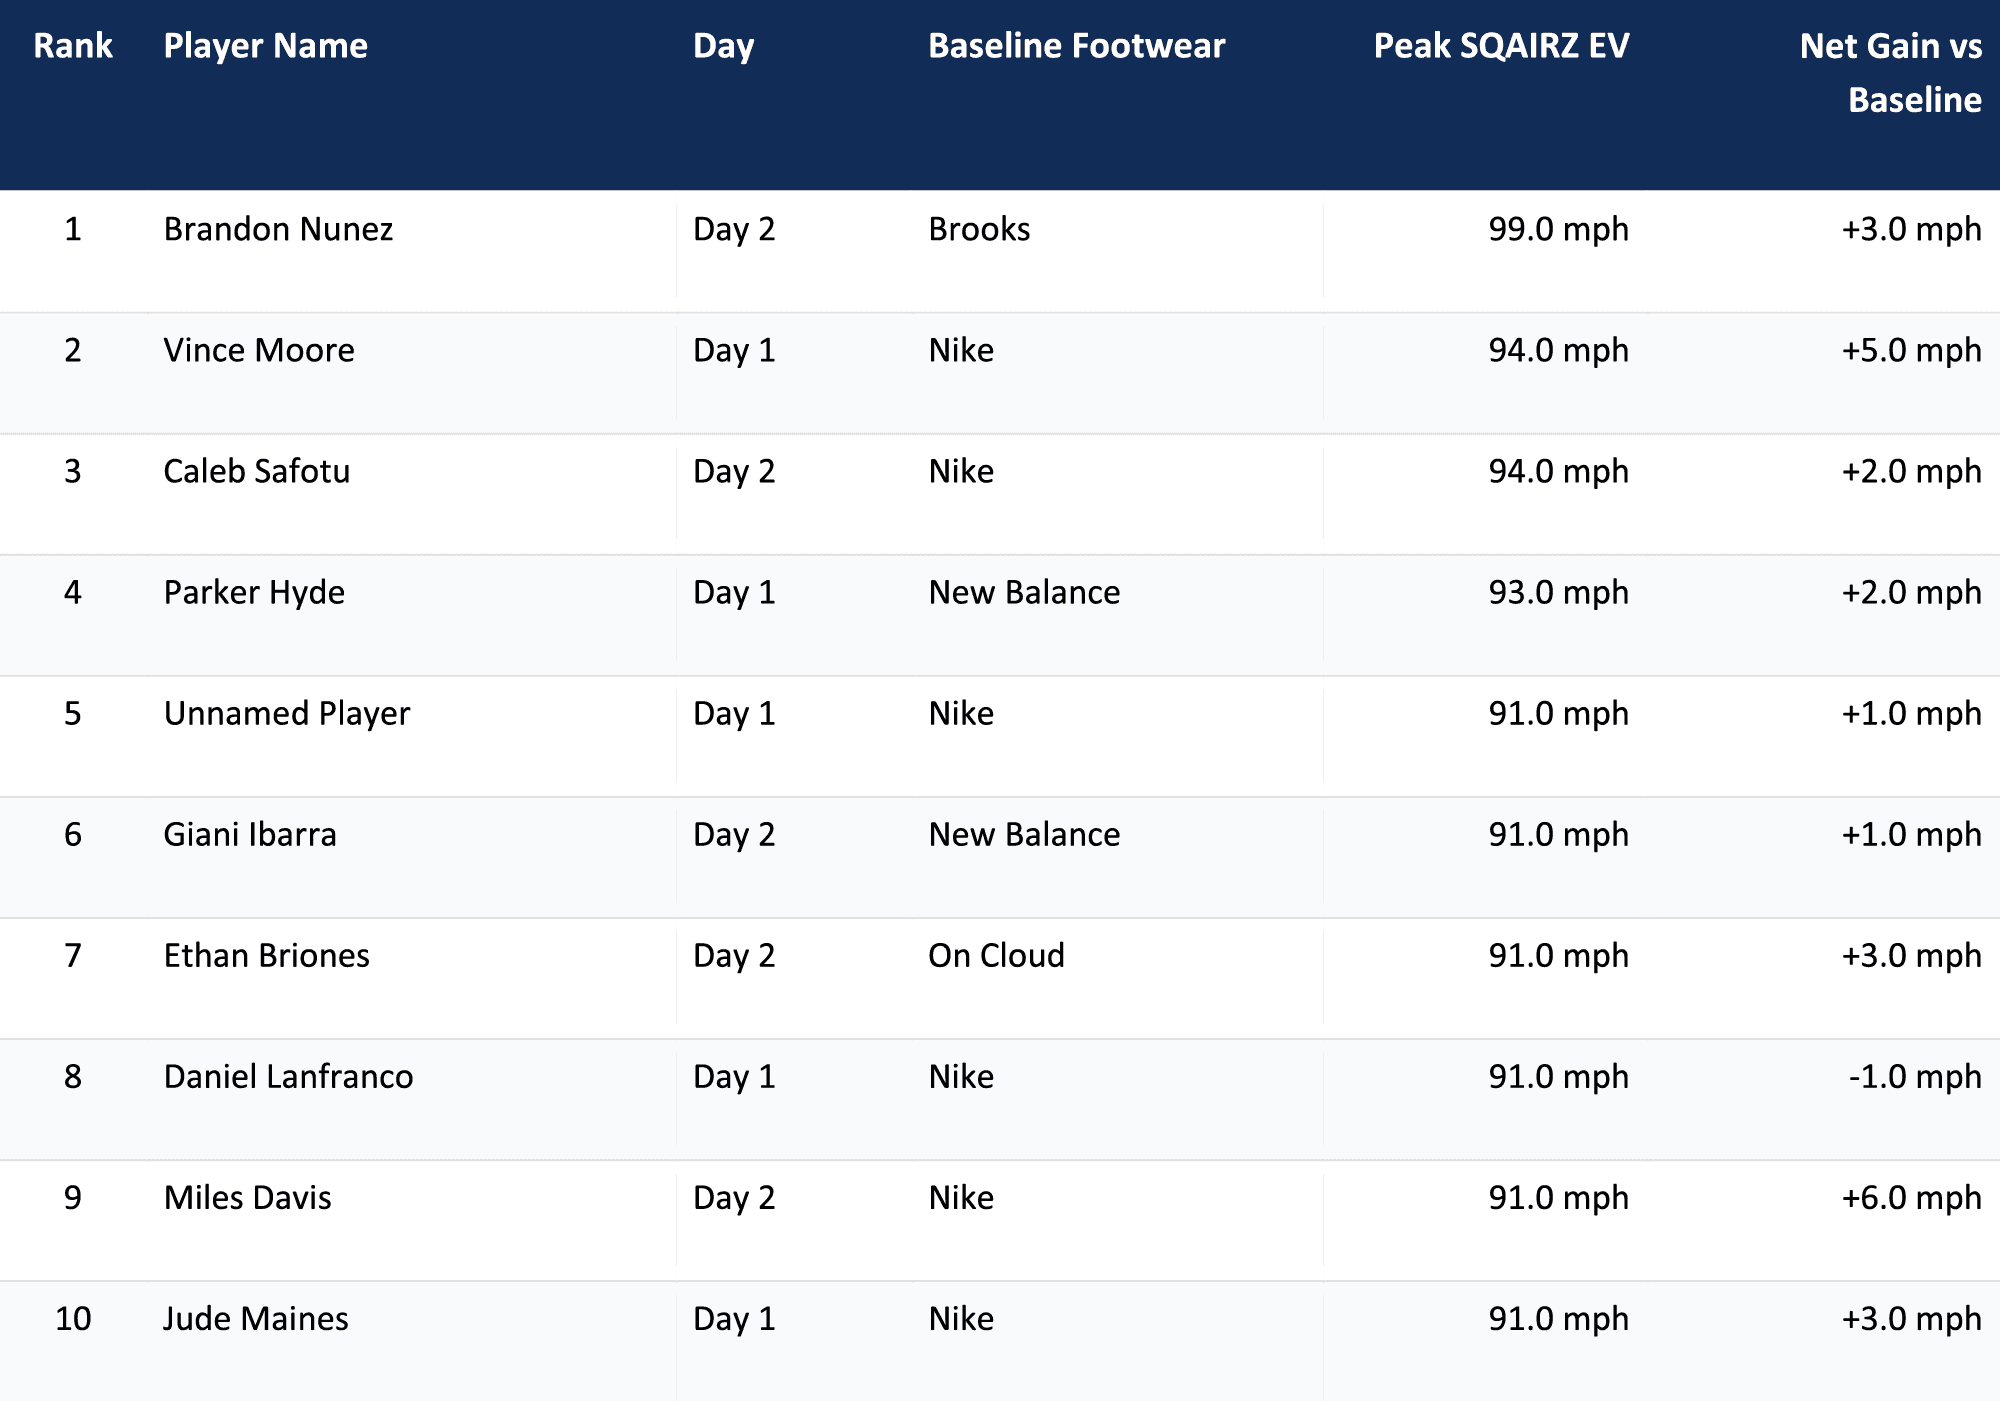
Leaderboard 1: Top Peak Exit Velocities Overall in SQAIRZ
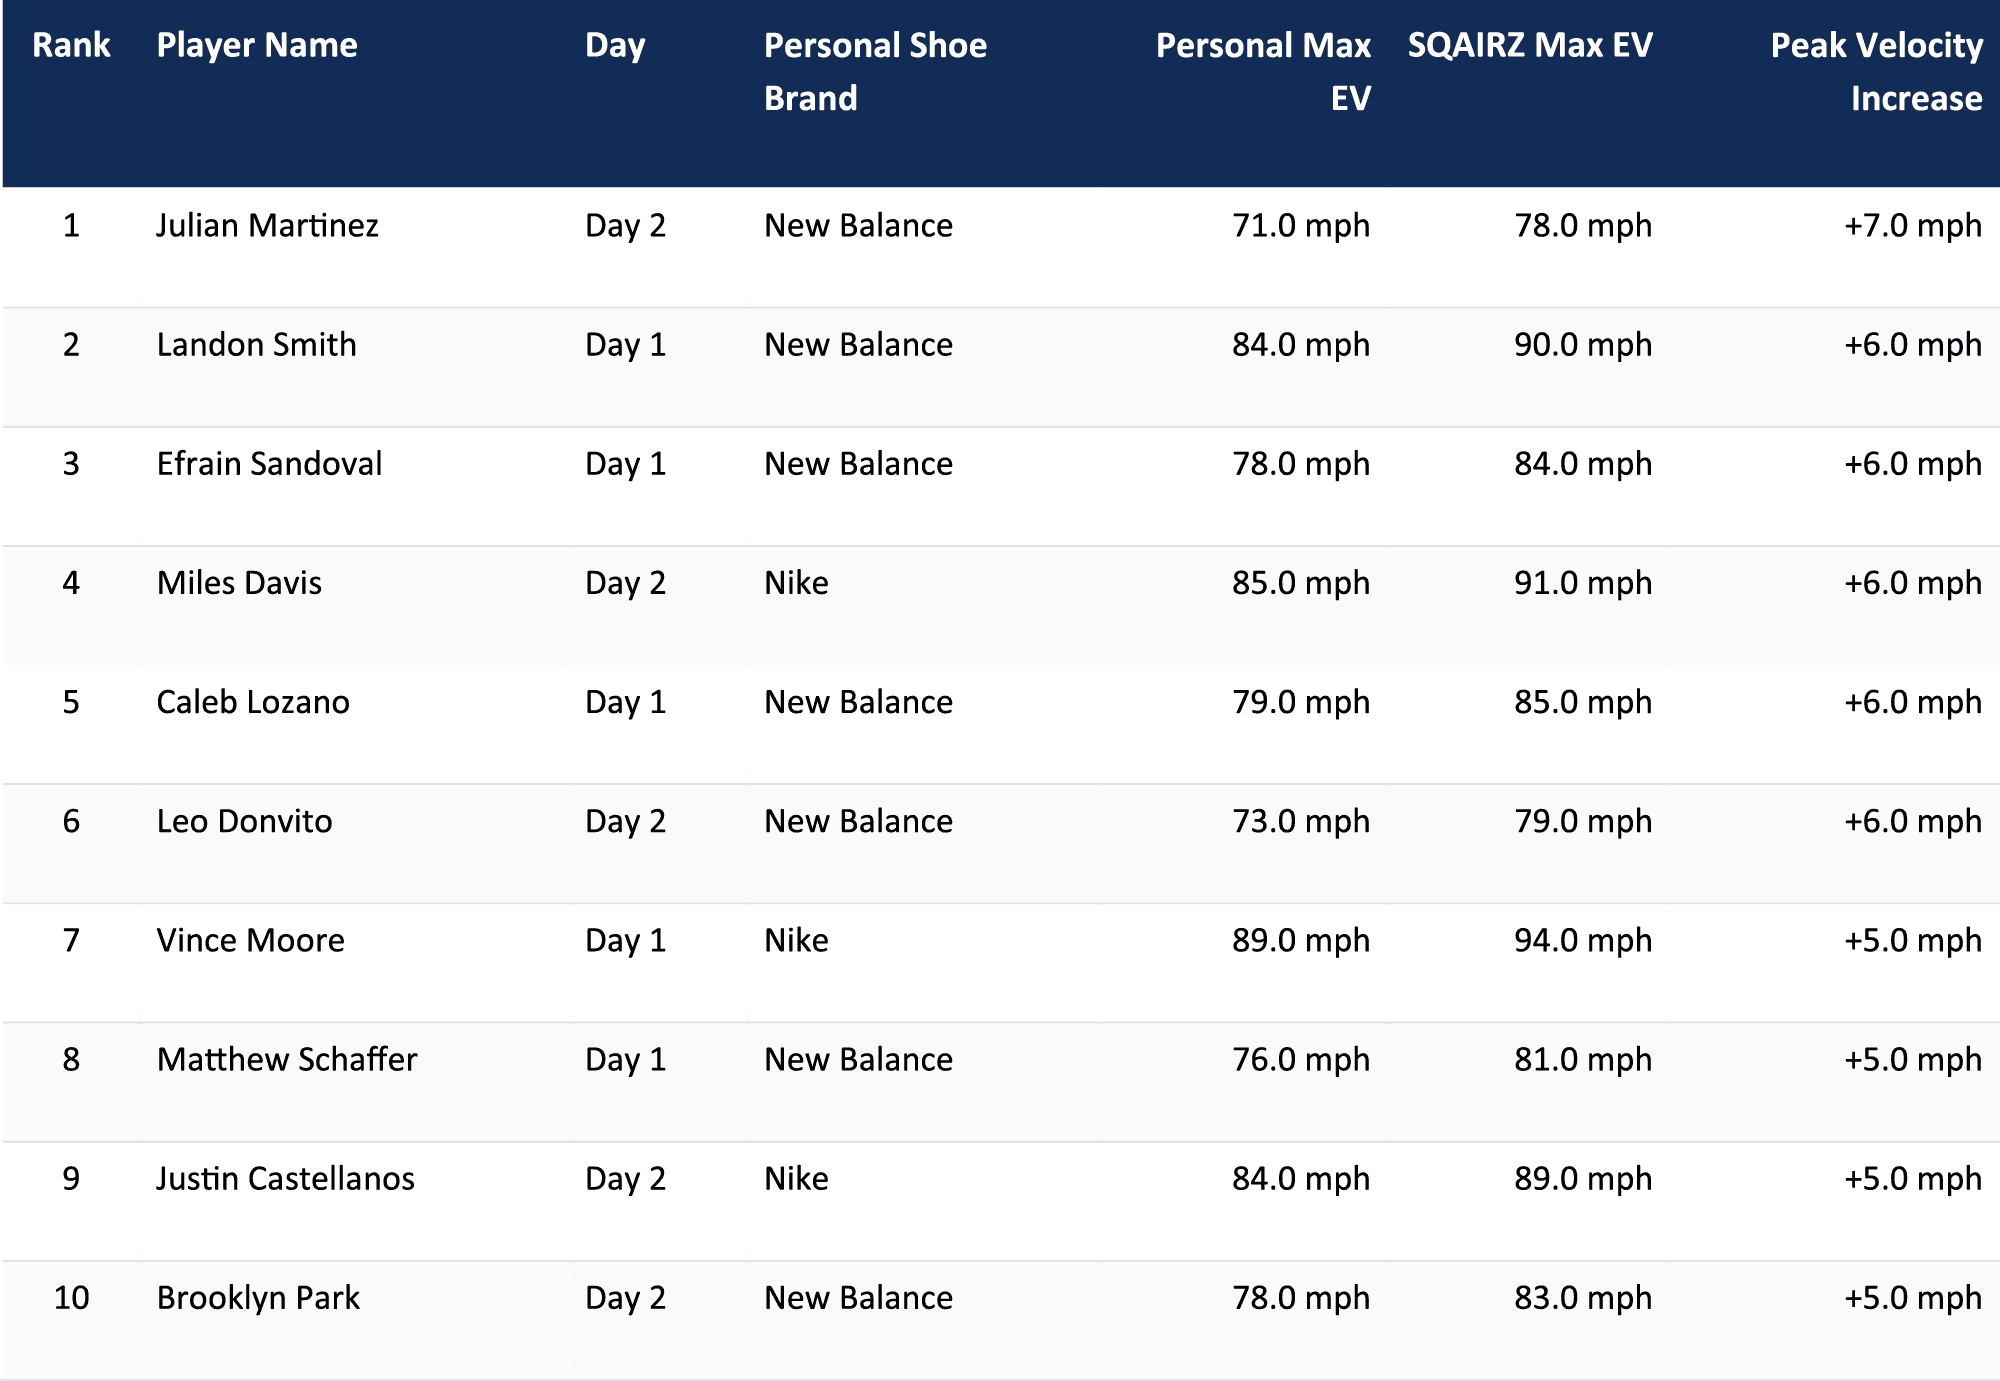
Leaderboard 2: Top Peak Exit Velocity Increases (Max EV Gain)
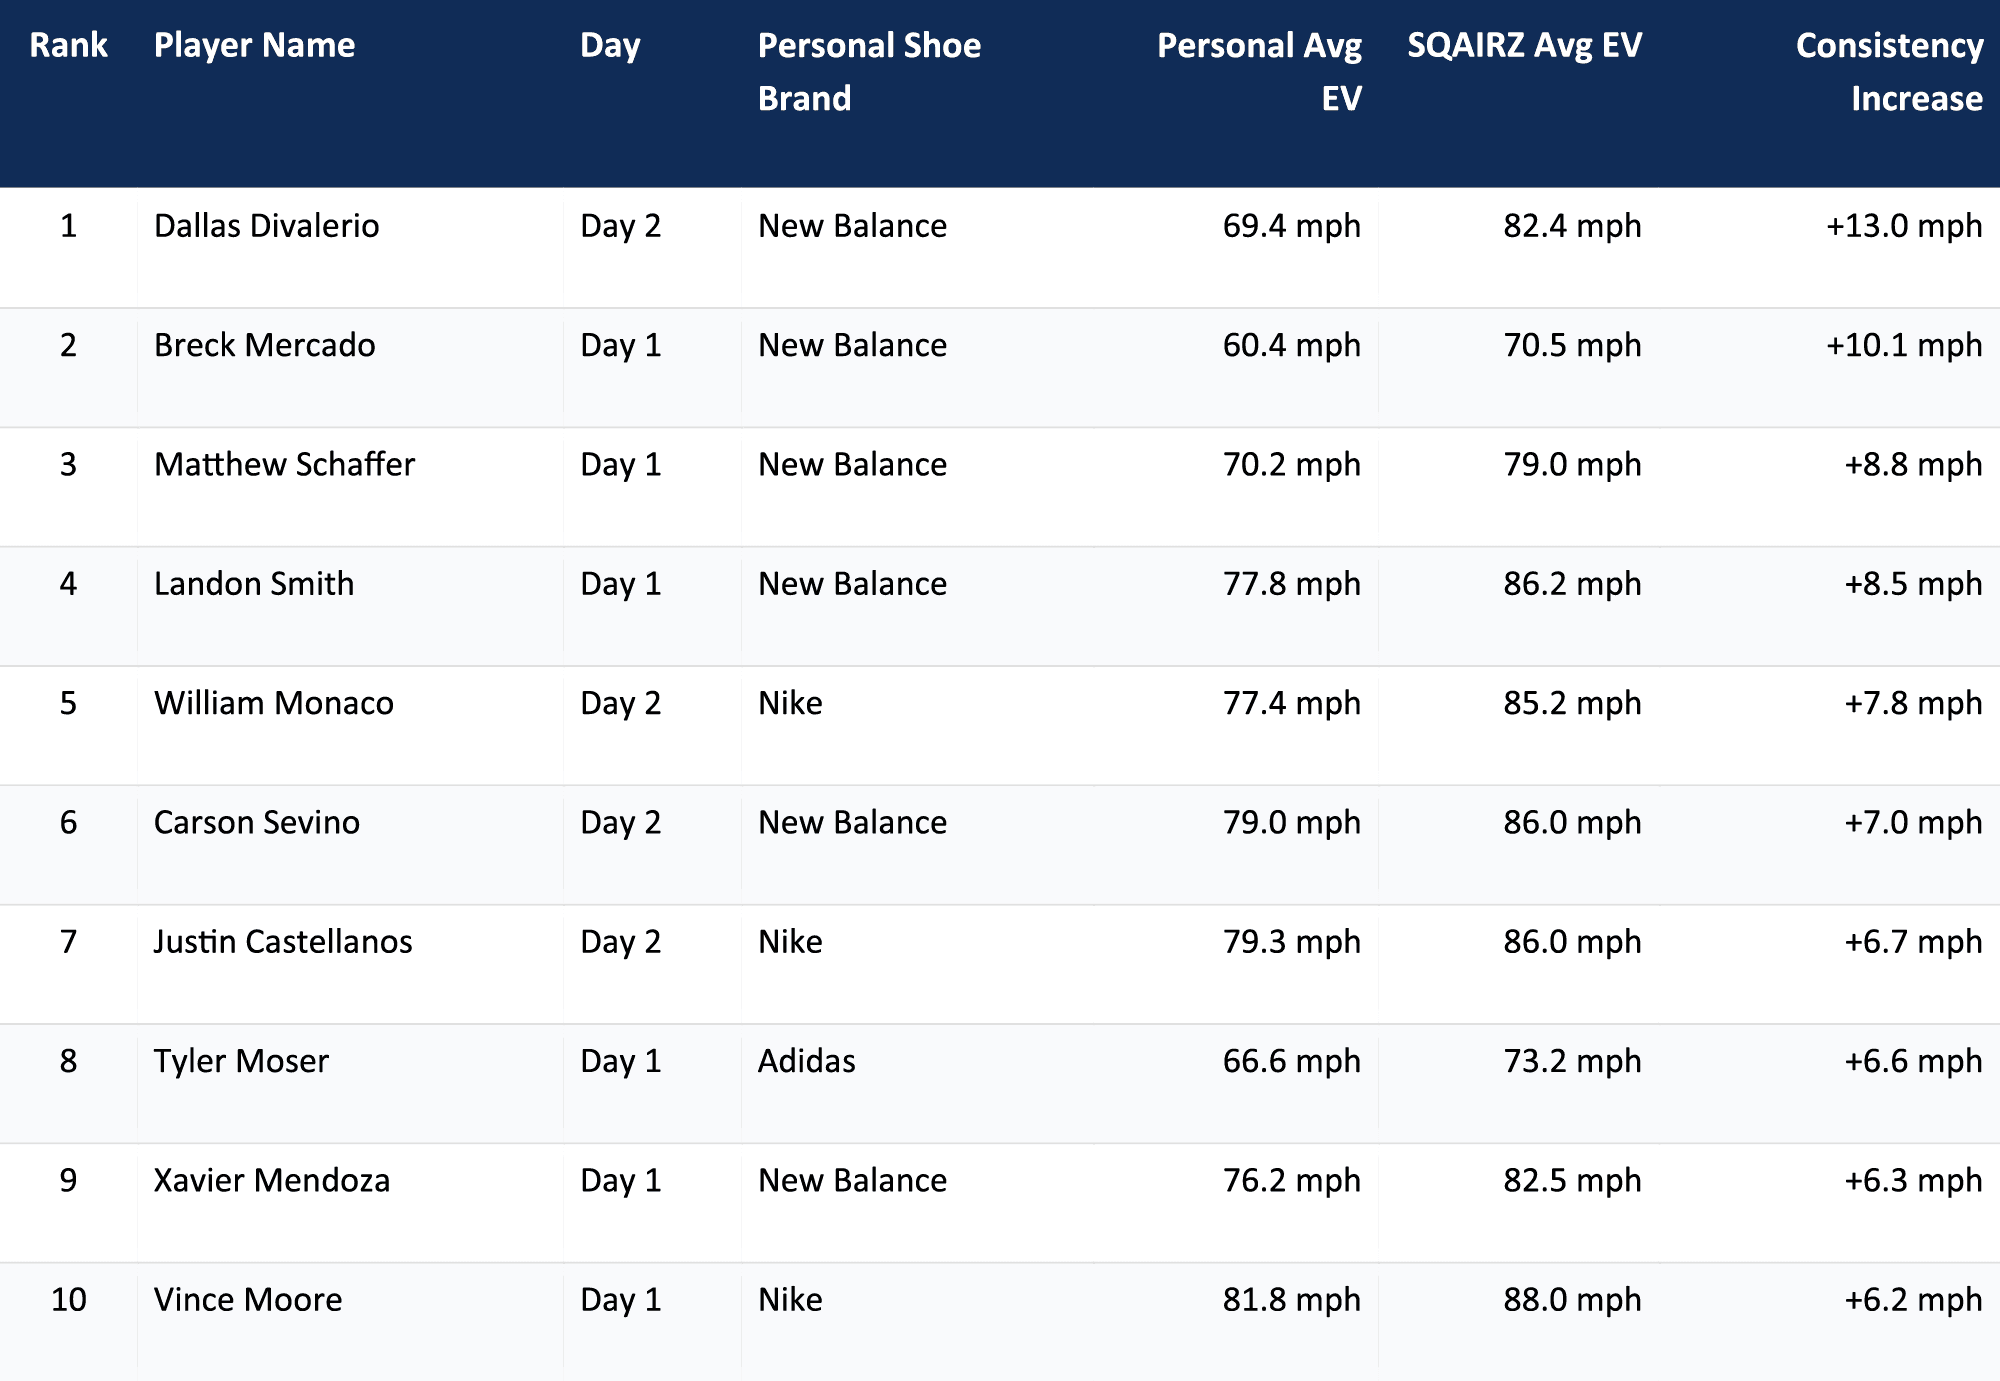
Leaderboard 3: Top Swing Consistency Gains (Average EV Gain)
4. Biomechanical Trends & Kinetic Insights
The "First-Swing Readiness"
Effect When analyzing swing sequences from Swing 1 through Swing 5, SQAIRZ showed a major advantage in immediate ground connection:
Personal Shoes: Athletes required 2 to 3 "feeling out" swings to establish footing, ramping up from 75.60 mph on Swing 1 to 77.51 mph on Swing 5 (+1.91 mph ramp-up).
SQAIRZ Shoes: Athletes generated 78.54 mph on Swing 1—starting out firing higher on Rep 1 than their final swing in personal shoes.
Peak Timing: 28.0% of all athletes hit their absolute max exit velocity on Swing 1 in SQAIRZ (compared to only 14.0% in personal shoes).
COACHING INSIGHT
Zero Ramp-Up: SQAIRZ provides immediate force transfer. The wide toe box and patented balance structure allow athletes to lock into the ground instantly without spending reps micro-adjusting their footing.
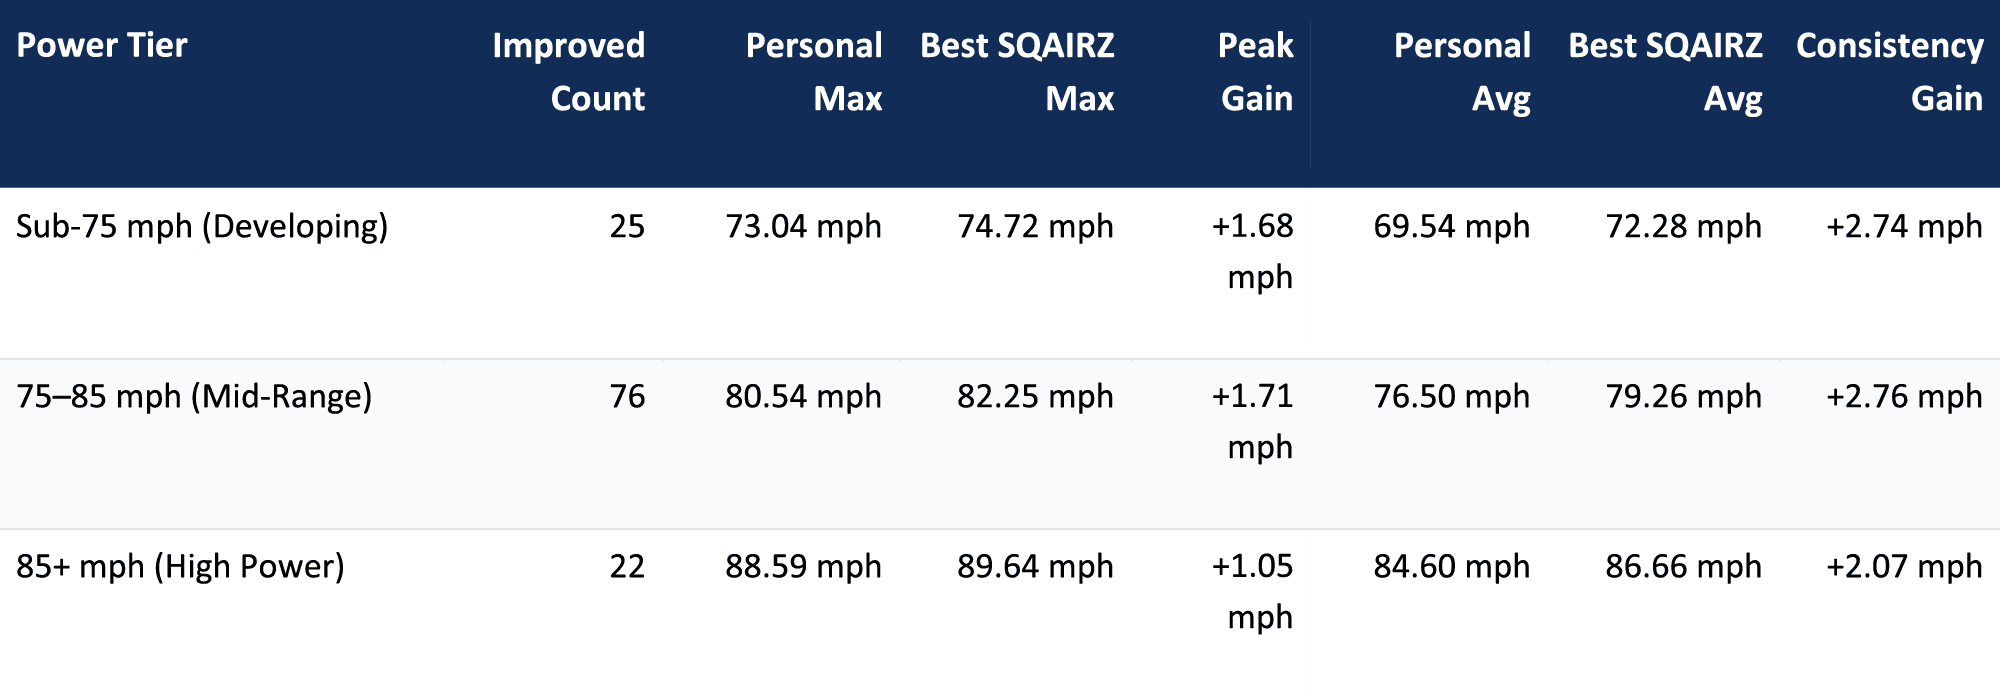
Performance Response by Power Tier
Categorizing players by baseline tee exit velocity illustrates how SQAIRZ benefits developing vs. elite hitters:
5. Standalone Analysis: Sizing Sensitivity & Retest Protocol
A separate analysis was conducted to evaluate the role of shoe fit on ground-coupling. During initial testing, 31 athletes (20.7% of the showcase field) experienced fit issues due to wearing SQAIRZ shoes that were 1/2 size too large, allowing micro-slippage inside the upper.
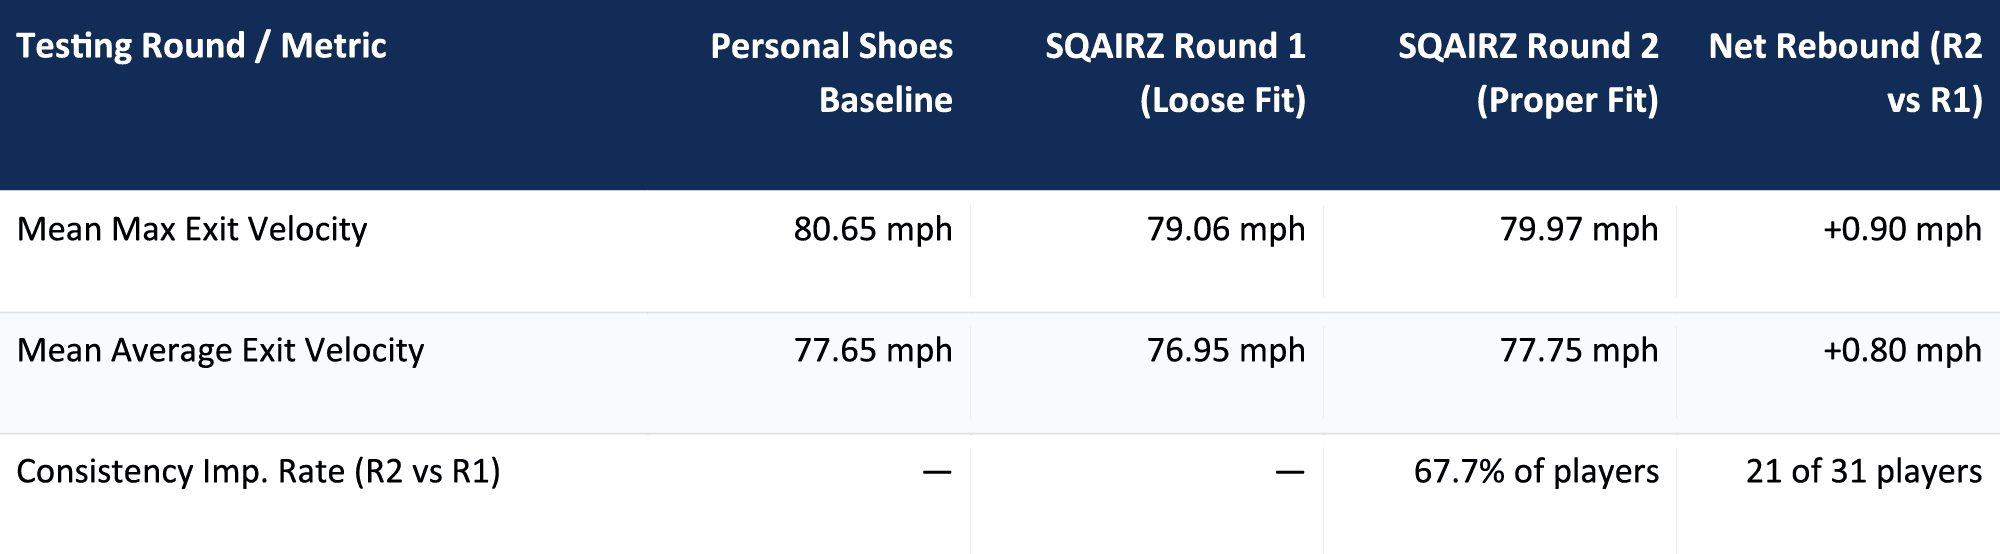
The Sizing Rebound Effect: In Round 1, athletes in loose shoes experienced foot slippage (-1.59 mph drop vs personal baseline). Sizing them down 1/2 size in Round 2 unlocked an immediate +0.90 mph rebound in Max EV and +0.80 mph rebound in Swing Consistency over Round 1.
Consistency Rebound Rate: 67.7% of retested players (21 of 31) improved their Average Exit Velocity in Round 2 vs Round 1, while 51.6% (16 of 31) improved their Peak Exit Velocity.
Brand Sizing Sensitivity: Under Armour (40.0%), On Cloud (33.3%), and New Balance (24.7%) users had the highest tendency to require a 1/2 size reduction due to being accustomed to loose/plush footwear fits.
6. Non-Improved Athletes
To maintain complete transparency across showcase results, 27 players (18.0% of the field) recorded lower exit velocities in SQAIRZ than in their personal footwear (-1.37 mph Max EV avg, -1.69 mph Avg EV avg).
Key factors contributing to this decline include:
Uncorrected Sizing Issues: SQAIRZ technology relies on a snug fit around the midfoot and heel. Players who wore loose shoes without retesting suffered kinetic energy absorption.
Showcase Rotational Fatigue: Tee testing conducted late in long showcase sessions introduces upper-body and core rotational fatigue, impacting bat speed regardless of shoe brand.
7. Strategic Takeaways for Marketing & Field Operations
1. Lead with Swing Consistency: 74.7% of all hitters (and 91.0% of the improved cohort) raised their average exit velocity. SQAIRZ makes a hitter's worst swing look much closer to their best swing.
2. Highlight First-Swing Readiness: 28% of hitters hit their showcase max on Swing 1 in SQAIRZ, eliminating warm-up ramp-time.
3. Feature the Improved Cohort Metrics: Among improved athletes, SQAIRZ generates a +1.59 mph lift in peak power and a +2.63 mph lift in swing consistency.
4. Implement Mandatory Fit Checks: Mandate precise fit checks during demo events to ensure forefoot ground-coupling on every player's first rep.

Translating exit velocity gains into on-field, in-game performance reveals a compelling story for players, coaches, and recruiters. The biomechanical ground-coupling provided by SQAIRZ doesn't just produce better laboratory numbers—it fundamentally alters a hitter's slugging capacity, plate discipline, and game consistency.
Here is how these specific metrics impact real-game efficiency and production:
In baseball and softball, exit velocity is the single strongest predictor of run production. According to modern biomechanical and TrackMan/MLB Statcast data:
Distance Expansion (+8 to +12 Feet)
Every additional 1.0 mph of Exit Velocity translates to approximately 5 to 8 feet of carry distance on drive angles. An average lift of +1.59 mph adds roughly 8 to 12 feet to a ball hit into the outfield.
In-Game Result: A deep fly ball that previously died on the warning track for an out now carries over the fence for a home run or clears an outfielder’s head for extra bases.
Shrinking Fielder Reaction Time
Higher EV forces infielders to react faster. A ground ball hit at 82 mph gives an infielder significantly less time to make a play than one hit at 80 mph, directly increasing hit probability (BABIP) on hard grounders and line drives.
In-Game Result: An increase in Exit Velocity (EV) compresses a defense's decision window by reducing ball flight time over fixed field distances. Every additional +1 mph of exit velocity cuts approximately 8 milliseconds of reaction time for an infielder (at 80 feet) and 15 to 25 milliseconds for an outfielder (at 150–250 feet). For an athlete gaining +1.59 mph in Max EV, defense reaction time drops by ~13 milliseconds in the infield and ~25 to 41 milliseconds in the outfield—forcing fielders to make quicker reads, shortening their lateral reach, and directly increasing hit probability on hard grounders and line drives.
2. The Power of +2.63 mph Swing Consistency (Average EV)
While peak EV represents a player's ceiling, Average EV represents their everyday production. A +2.63 mph jump in average EV across a season is often the difference between an average starter and an All-Conference hitter:
Raising the Floor on Off-Center Hits: Hits aren't always made on the sweet spot. SQAIRZ’s wide toe box and stable base prevent foot-roll during the swing, keeping the lower body anchored. This ground stability transfers more force into the barrel even on mishits.
Eliminating "Weak Contact": Bringing a hitter's lowest swing velocities closer to their peak means fewer routine pop-ups and weak groundouts. Instead, mishits turn into hard-hit grounders through the hole or solid outfield liners.
3. "First-Swing Readiness" & In-Game At-Bat Dynamics
The data showed that 28.0% of players hit their peak EV on Swing 1 in SQAIRZ (compared to needing 2–3 ramp-up swings in personal shoes).
In a real game, pitchers often throw the best pitch to hit early in the count (often a first-pitch fastball for a strike):
No Warm-Up Swing Needed: Hitters who take 2 to 3 swings to "find their footing" are at a severe disadvantage when jumping on a first-pitch strike.
First-Pitch Force Transfer: Being locked into the ground from the second a hitter steps into the box allows them to ambush first-pitch strikes with 100% of their lower-body power, capitalizing on the highest-value pitches they see all game.
4. Reducing Swing Energy Expenditure (Late-Game Endurance)
When a shoe provides a solid foundation, the athlete doesn't rely on micro-adjustments in their feet and ankles to generate torque.
Rotational Efficiency: By removing kinetic leak at the feet, hitters use less upper-body muscle strain to accelerate the bat.
Clutch At-Bats: Late in a double-header or the 7th/9th inning of a tough game, lower-body stability keeps swing mechanics intact when physical fatigue sets in.
SUMMARY TAKEAWAY FOR FIELD REPS & COACHES
"SQAIRZ doesn't just take a player's best swing 10 feet farther—it makes their 8th-inning mishit hard enough to carry over the infielder's glove. It raises a hitter's overall baseline so they perform like their best self on every single pitch."